Reports जो खुद लिखी जाती हैं.
Automatically generated monthly reports काम किए घंटे, punctuality rates और attendance trends दिखाती हैं। एक click में daily, weekly या monthly timesheets CSV के रूप में export करें — payroll और compliance के लिए ready।
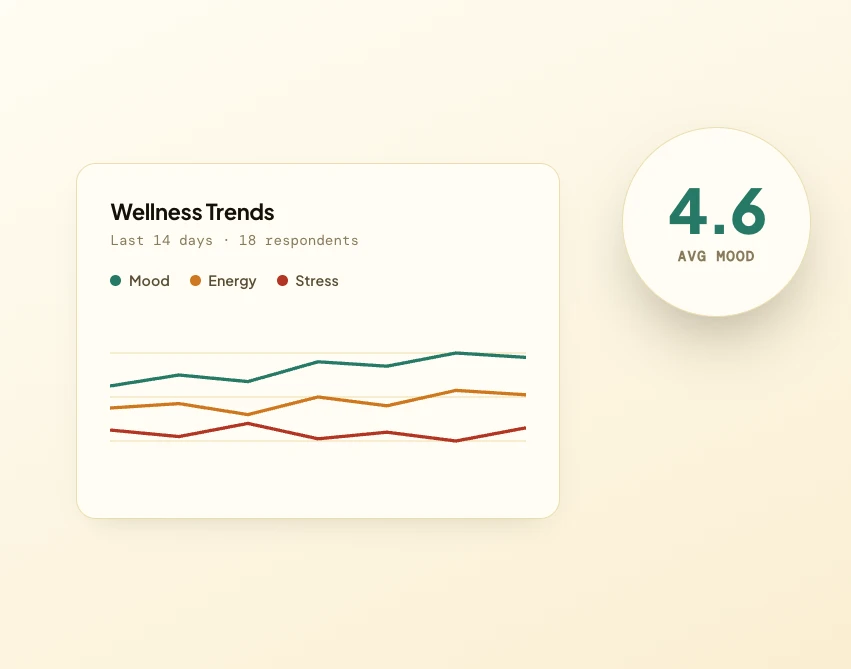
Time-tracking और wellness data को actionable insights में transform करें। Beautiful visualizations, automated reports और AI-powered analytics ताकि आपकी टीम स्वस्थ और productive रहे।

Automatic timesheet reports से interactive charts और proactive wellbeing alerts तक — Asa उस data को जो आपकी टीम पहले से generate करती है उन decisions में बदलता है जिनपर आप act कर सकते हैं।
Automatically generated monthly reports काम किए घंटे, punctuality rates और attendance trends दिखाती हैं। एक click में daily, weekly या monthly timesheets CSV के रूप में export करें — payroll और compliance के लिए ready।


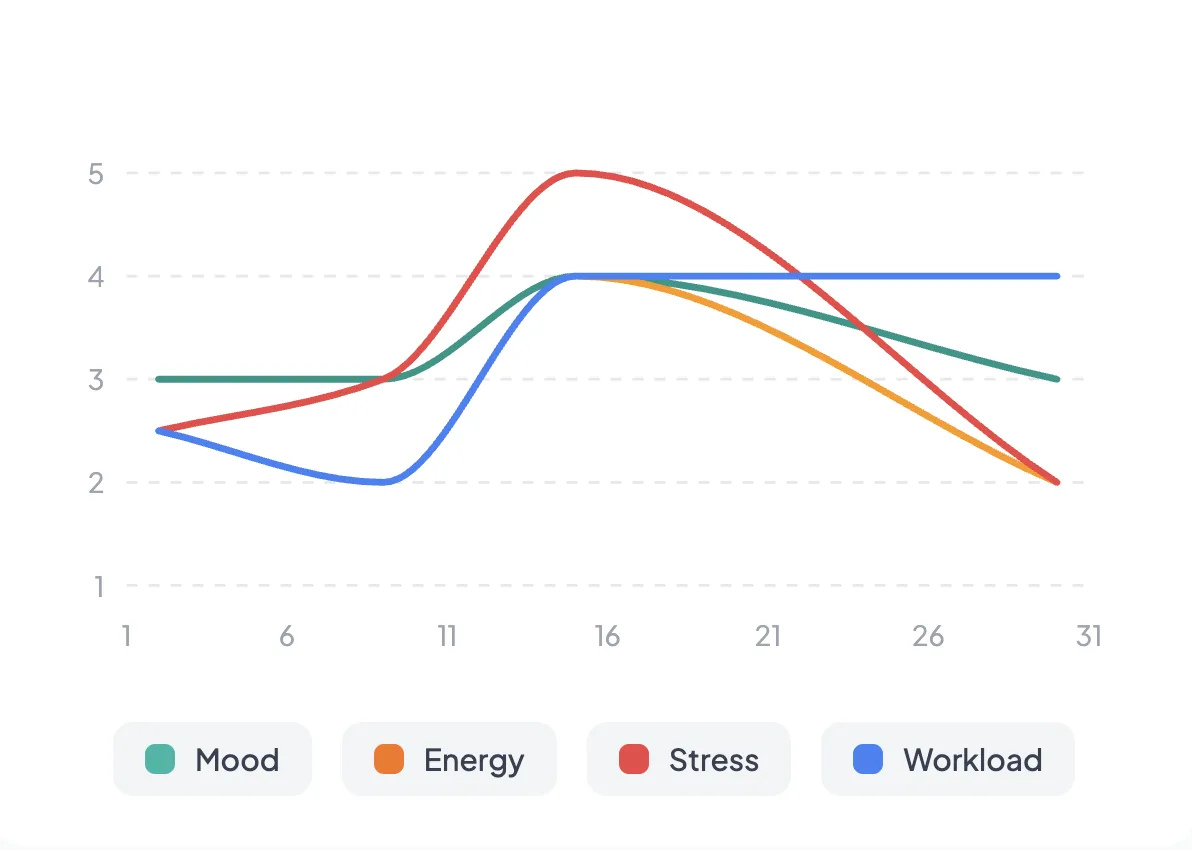
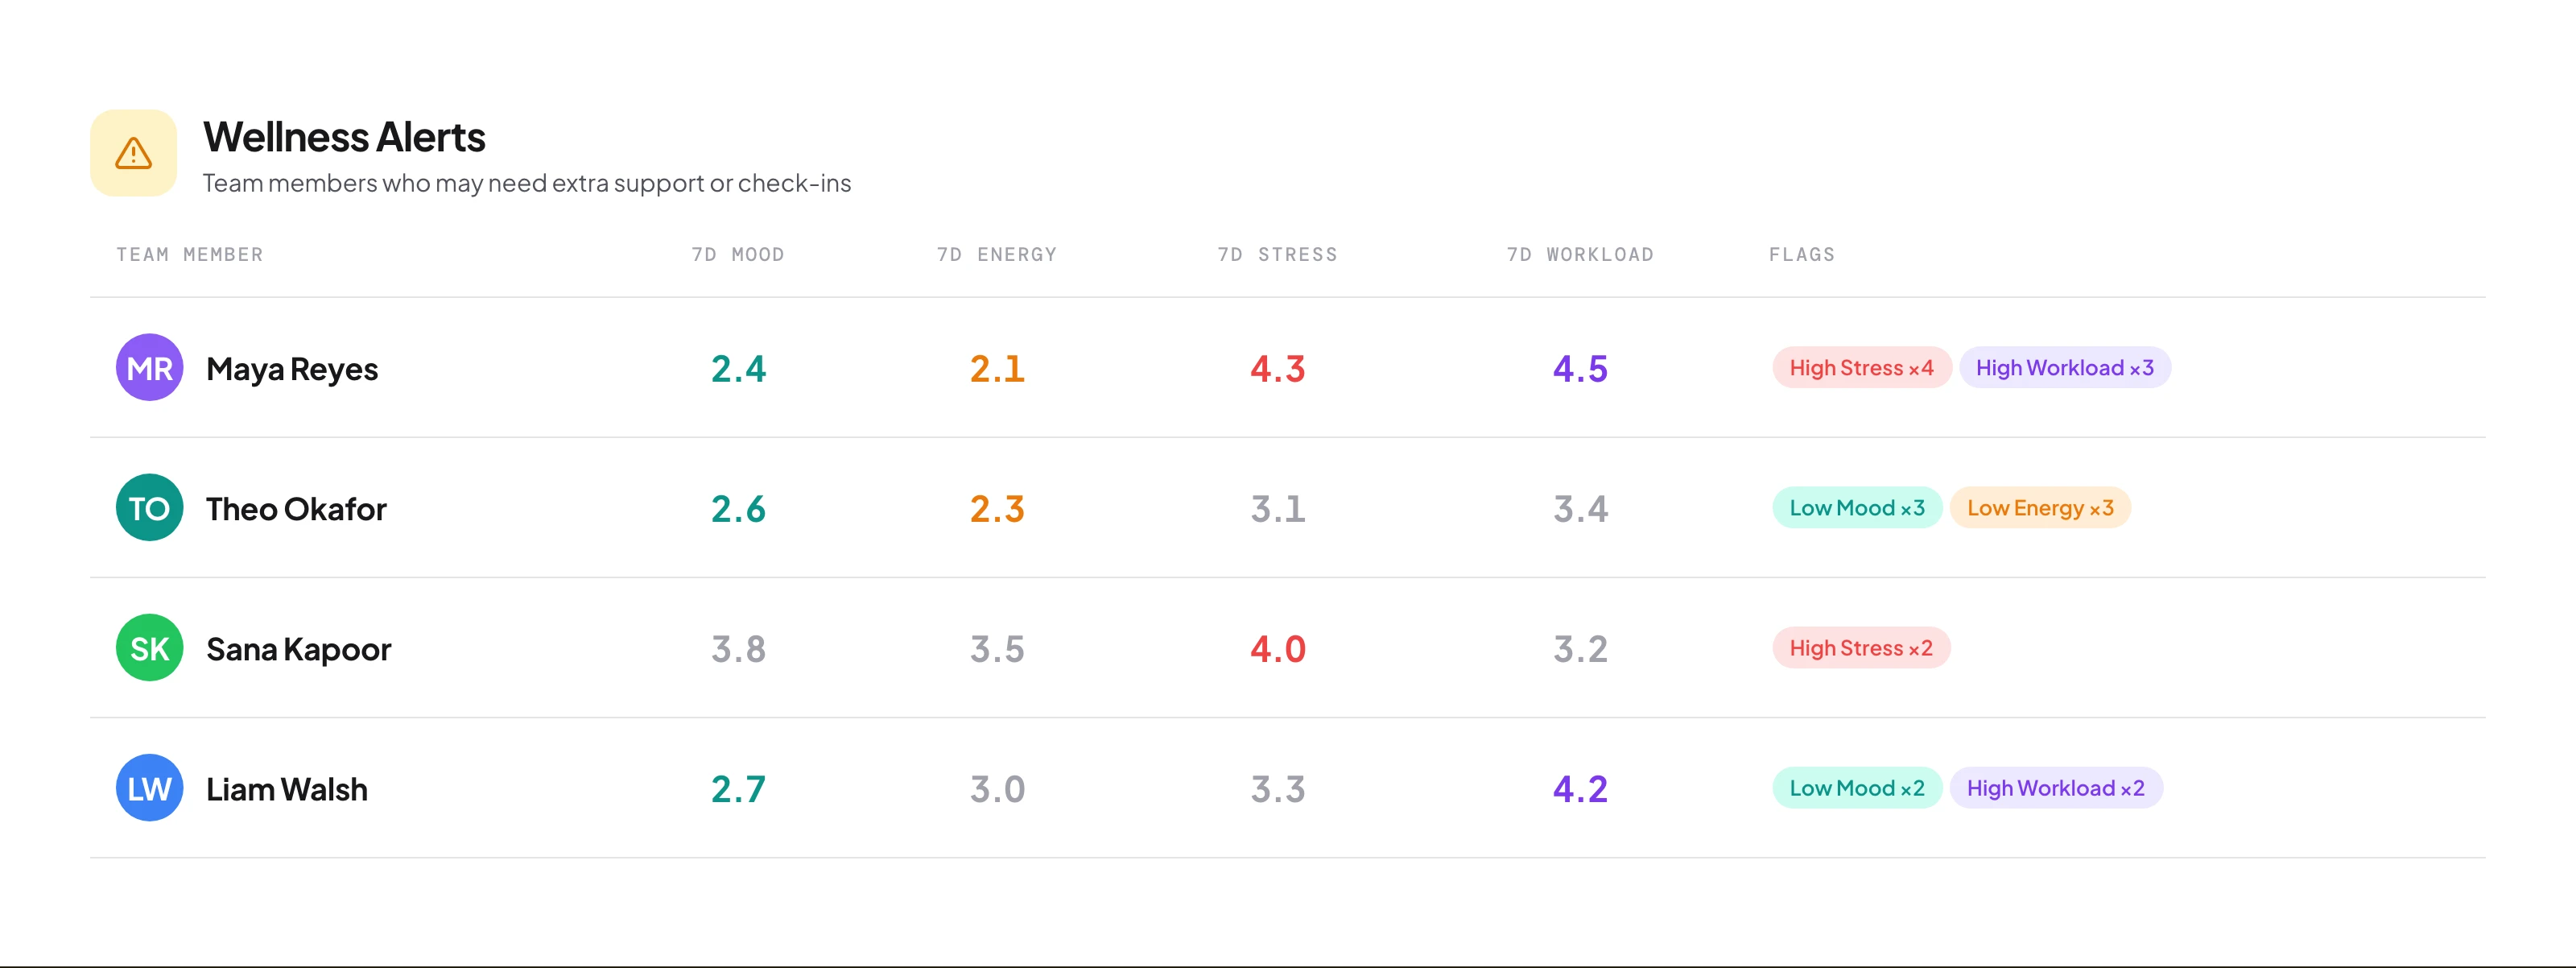
7-day rolling analytics के साथ team mood, energy, stress और workload track करें। Admins employee-submitted entries से member-level trends और named alerts देख सकते हैं; admin summaries में AI-inferred entries शामिल नहीं होतीं।
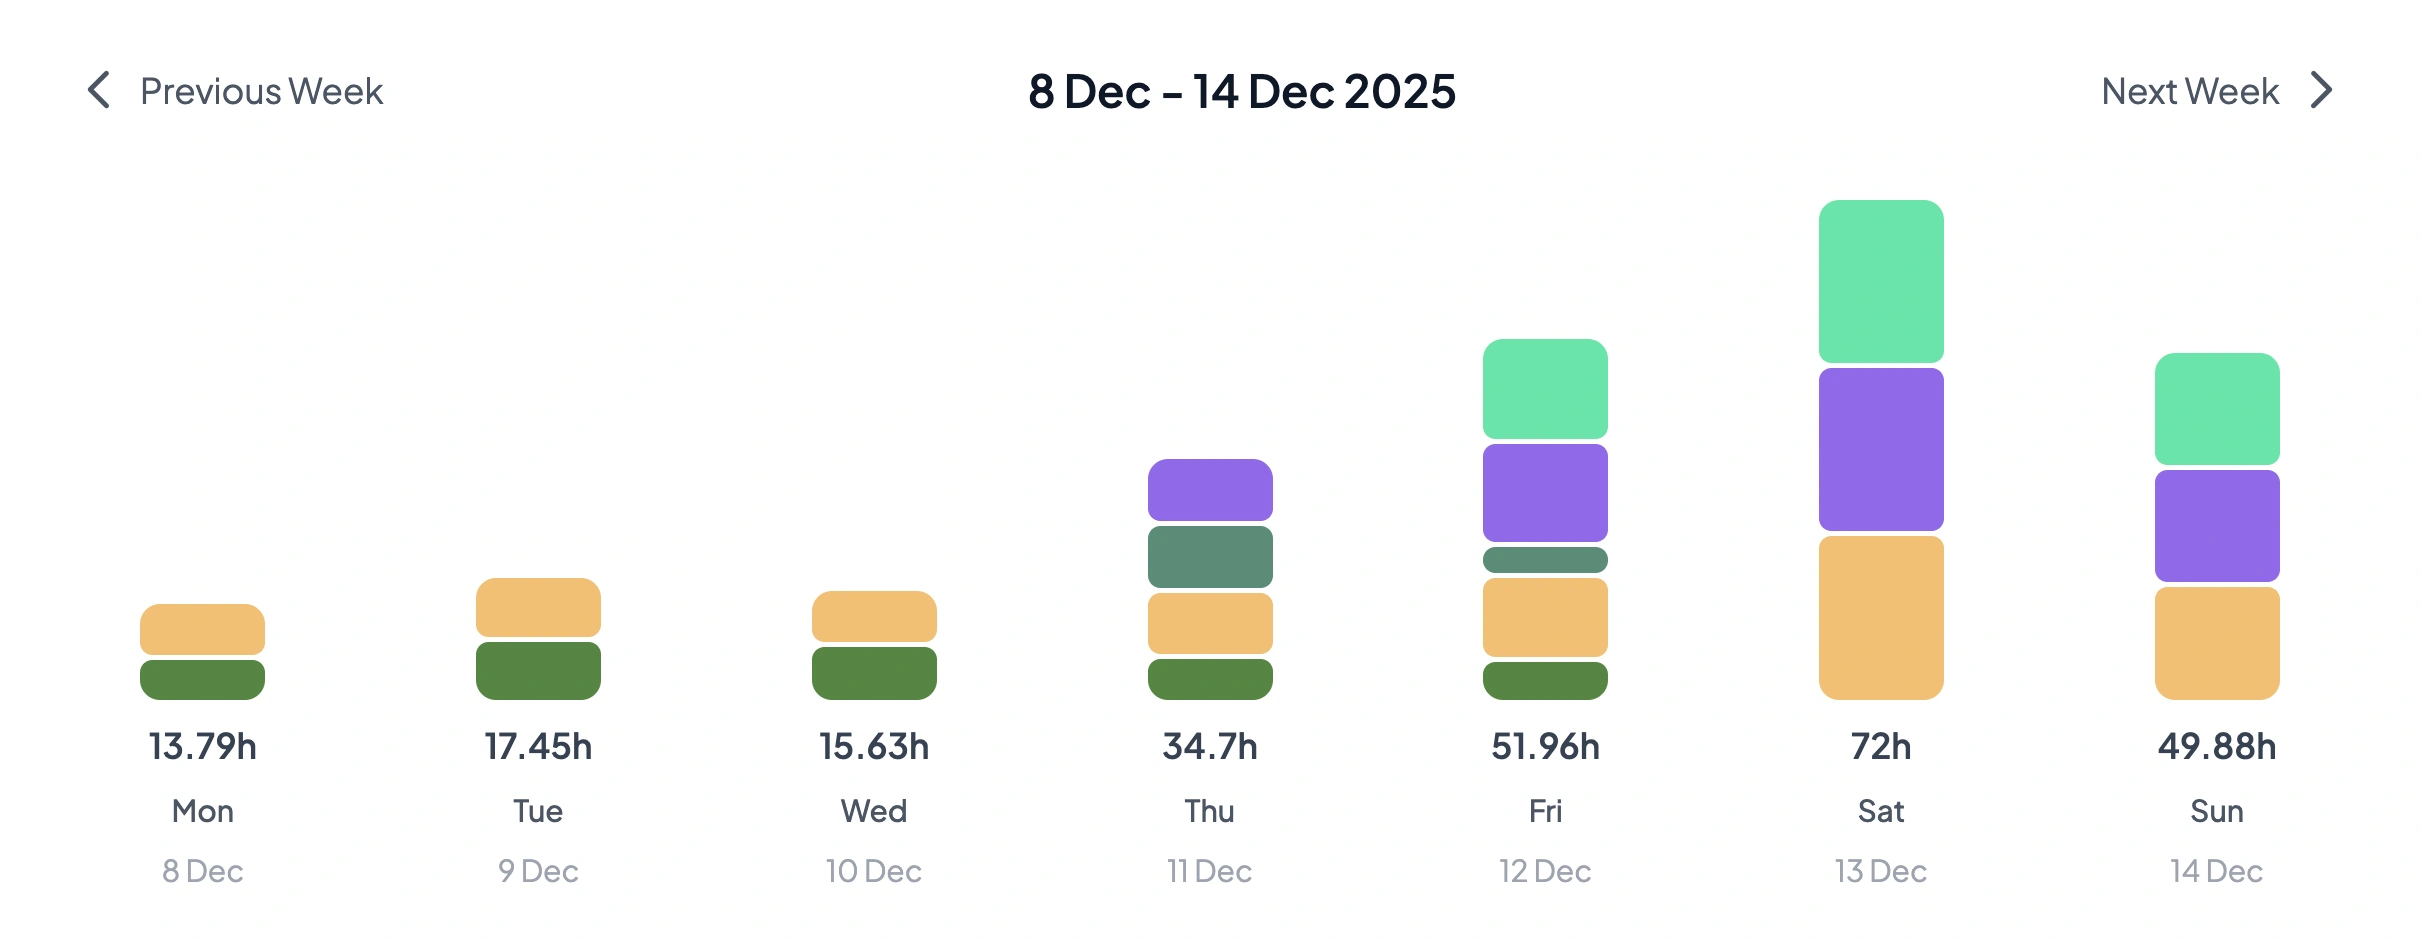
Bar और line charts एक नज़र में patterns surface करते हैं। Daily hours compare करें, महीने भर mood trends track करें और punctuality visualize करें, toggle-able chart types और drill-down के साथ।


Wellness concerns के लिए alerts पाएं — consecutive low-mood days, high-stress streaks, low-energy patterns। Admin dashboard 7-day summaries और follow-up notes के साथ support की ज़रूरत वाले members surface करता है।
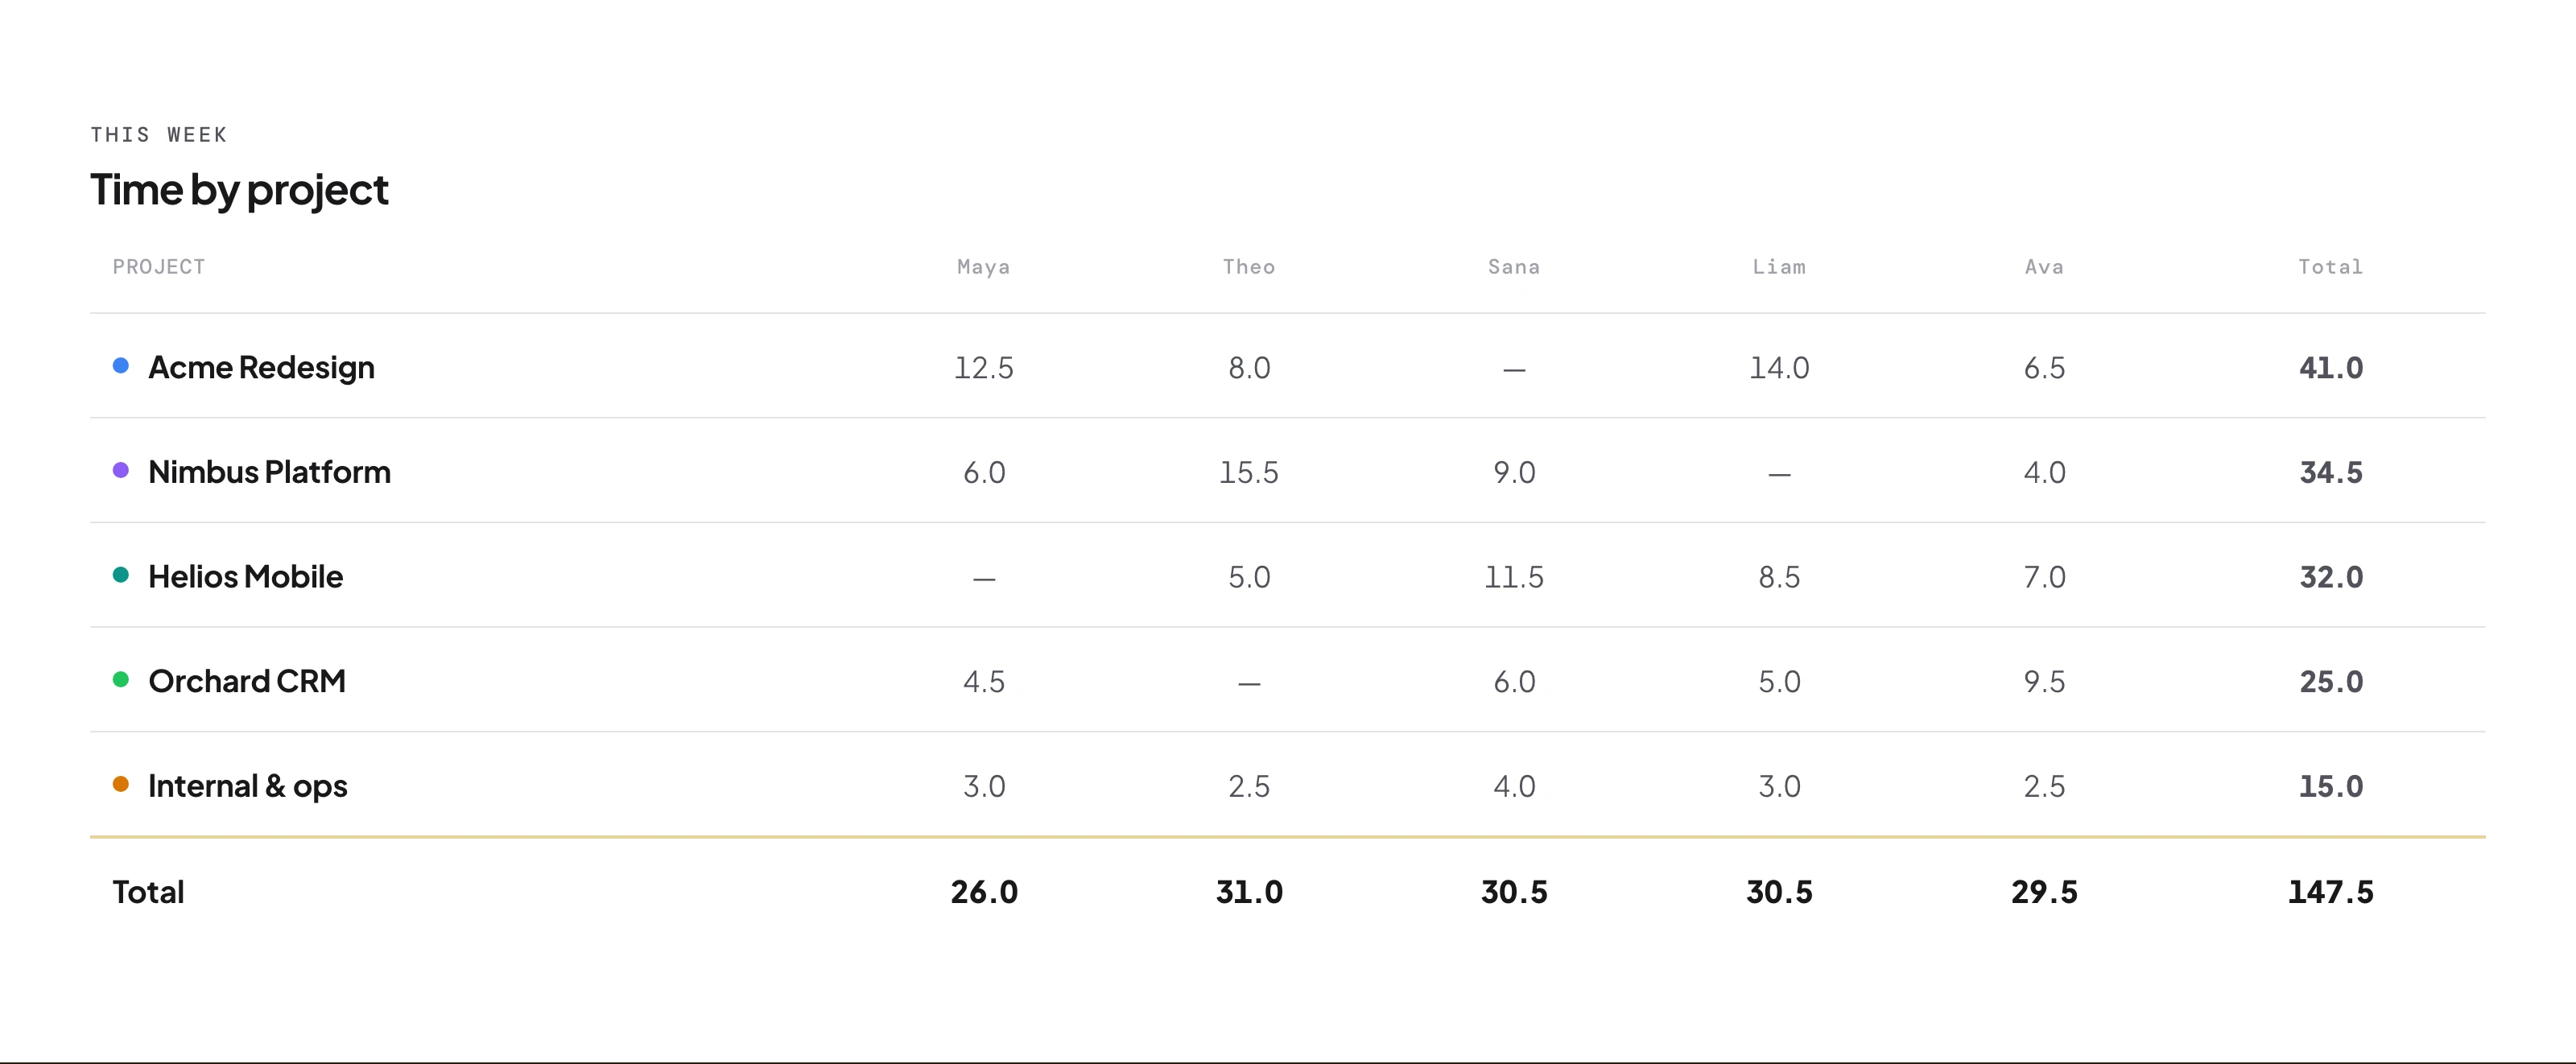
Real-time stats जिसमें आज के कुल team hours, team size, active members और on-time percentage शामिल हैं — साथ में wellness trends, project breakdowns, leave status और pending amendments।
Daily hours के लिए bar charts और mood और wellness trends के लिए line charts। Charts interactive हैं — types toggle करें और detailed analysis के लिए specific periods में drill करें।
हाँ। Timesheet data एक click में CSV के रूप में export होती है — daily, weekly या monthly, member और date range से filtered, payroll, client billing या compliance के लिए ready।
यह 7-day rolling averages उपयोग करके mood, energy, stress और workload track करती है, aggregate scores दिखाती है और उन members को flag करती है जिन्हें concerning patterns के आधार पर support की ज़रूरत हो।
Employee-submitted check-ins में patterns मिलने पर AI members को 7-day summaries और follow-up notes के साथ admin dashboard पर दिखाता है। यह सभी plans में उपलब्ध है।
Members अपनी attendance और timesheets देखते हैं। Admins member-level wellness summaries और named alerts देख सकते हैं; AI-inferred entries admin views से हटाई जाती हैं।
Donut charts दिखाते हैं कि team hours active projects में कैसे distribute होते हैं — separate reports चलाए बिना समय कहाँ जाता है इसका एक quick visual breakdown।
Scheduled clock-ins और configurable grace periods के आधार पर on-time percentages — individual और team-wide rates, late patterns और समय के साथ attendance trends।
Dashboard, timesheet reports, CSV exports, wellness trends और AI wellness alerts सभी plans में उपलब्ध हैं।
यह default landing page है जब आप log in करते हैं, automatically आपकी role के अनुसार stats दिखाता है — admins team-wide data देखते हैं, members अपनी personal attendance summary देखते हैं।
आपका dashboard sign in करते ही ready है — team hours, punctuality, project breakdowns और wellbeing trends। Basic analytics हर plan पर मुफ्त।